Viewing entries tagged
books

1 Comment

Film School Advice for Data Analysts


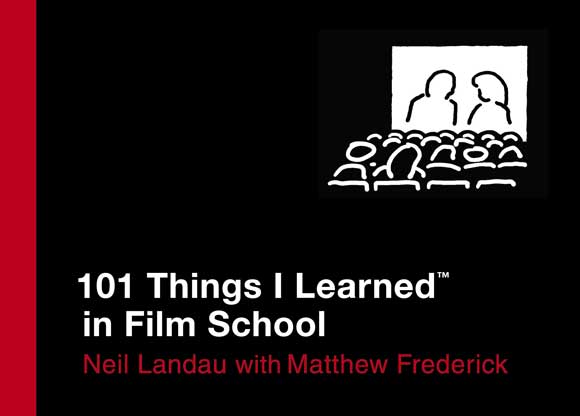
I just finished reading Neil Landau and Matthew Frederick's delightful little book, 101 Things I Learned in Film School. (It's part of an entire series of books that started with Frederick's own 101 Things I Learned in Architecture School, of which more will be said at a later date. The other titles address fashion school, culinary school, and business school. I will address these, too, at later dates.) What's most interesting about this book is not that plan on going to film school or working with film as such but that I can see at least some connection between many of the ideas in the book and my own goal of data analysis (believe it or not). The idea is this: when you analyze data, you are telling a story, and stories can be told in ways that are more or less interesting, informative, or effective. Inasmuch as cinema also tells stories, some of the principle carry over. For example:

  • 10: Make Psychology Visual. That is, by changing camera angles and distance, different meanings can be ascribed to a scene. The same is true for designing visualizations (I imagine).
  • 14: Beginning, Middle, End. That is, there is a comfortable narrative structure to a film, and that structure can be repeated at smaller scales. Although visualizations are typically presented as static images, they can still present a form of narrative. This is especially true for those gigantic, long infographics you'll see. And it is certainly true for any video-based visualization (and maybe there should be more of those).
  • 22: Plot is physical events; story is emotional events. Data analysis is more than just presenting bits of information (i.e., the physical events). It is an exercise in meaning-making through the interpretation and application of insights derived from analysis (akin to the "emotional" component of the story).
  • 64: Dig Deeper. "Do fewer things, but do them better." In analysis, rather than presenting as many factoids as possible, it is better to understand the distinctive characteristics of the nature, such as why there are outliers on a particular variable, why a scatterplot is curved instead of straight, and why the wording of two similar questions gives different answers.
  • 93: "Perfection is achieved, not when there is nothing more to add, but when there is nothing left to take away.” — Antoine de Saint-Exupéry. It's very easy and very tempting to add more charts, more variables, more tables, more stuff to an analysis. But people have a limited attention span and the analysis is often understood in a heuristic fashion anyhow, so it's much better to limit oneself to the minimum amount of analysis that will give a valid and useful conclusion.

So, it may be a bit of a stretch, but that's actually what I had in mind when I was reading this fine book and the other ones in the series. Inspiration is everywhere.

1 Comment

Comment

The Lego Bible (Literally)

I just came across this and had to post it because (a) it's hilarious; and (b) I thinks it's of real pedagogical value. This is the short version: The Reverend Brendan Powell Smith (although the "Reverend" part is apparently an ironic appellation) has spent about 10 years creating nearly 5000 scenes from the Bible with Legos. Here's a scene from the Garden of Eden:

Excellent! And here's a part of the Table of Contents:

I also like the "Adult Content" warning he has at the bottom of the page. (And I understand that, yes, in fact, the work is not entirely safe for kids.)

And you'll be glad to know that he has a book out! (Several, actually, but this one is most germane):

So, there you have it. Make of it what you will but you have to give three cheers for Legos in literature!

Comment

Comment

Max & Me

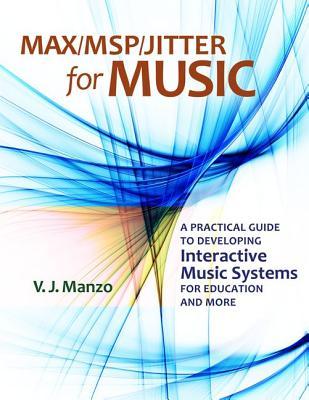
A simple patch in the software Max I just made my very first patch in Max (v. 6), otherwise known as Max/MSP/Jitter, which is brought to us by the fine people at Cycling ’74. I feel like a proud papa! (If you click on the circles — in Max, that is — they’ll light up in order of connection.) I’m just following along in V. J. Manzo’s book Max/MSP/Jitter for Music: A Practical Guide to Developing Interactive Music Systems for Education and More (where I’m part of the “and More” crowd). Here’s the book:

This is significant because I’m going to be taking a self-organized course next semester at the University of Utah in an attempt to learn how to (eventually) do data visualization with Max. Should be fun… and it’s very nice to be off and rolling!

Comment

Comment

Upcoming Arduino Adventure

Next semester I have some free space in my schedule that I need to fill up with Fine Arts credits if I want to get my Arts Technology Certificate this year. I felt rather clever this semester for designing my own 4-credit class in Processing, which I taught myself (although I am not the teacher of record). I decided to do a similar thing next semester, where I will work on the most logical extension of the Processing class: Arduino, the physical world analogue of Processing. There's a tiny little book on it called Getting Started with Arduino (now in its second edition):

I think I'll just go through it from start to finish. That shouldn't take long, although it will take some supplies, so I've already ordered the complete set of materials from Maker Shed. (I think I'll get to know these guys awfully well.)

However, that book will be quick. As a way of making a full course, I'm considering trying to go through Tom Igoe's charming but substantial book Making Things Talk (also in its second edition), which also serves as great introduction to the field of physical computing:

I'm still trying to figure out exactly how much of that book I would be able to do (and how much it would cost!). But in a happy turn of events, I just came across a blog called Doing the Projects in Making Things Talk, where the author chronicles his journey through the first edition fo the book:

Anyhow, this should be an excellent guide. I'll have to read through it before I undertake my own adventure.

And, finally, I think that I'm going to send out an invitation to see if there are any other students who would like to join me in this "class" (or in another one I'm planning on using Max/MSP, but more on that another time). It would be nice to have company, wouldn't it?

Comment

Comment

Adobe and Me

We're getting started with Photoshop (and the Adobe Creative Suite in general) in FA2000: Computers and the Arts. Very exciting! It's an overwhelming program; so many choices, so many buttons. Ay yi yi . . . But I'm thrilled to have put the lettuce and beans on their own layers in the salad photo! Very cool to move things around so easily. To quote the theme from The Love Boat: "So exciting and new!" (Well, new to me, anyhow.)

Also, in FA3000: Design for the Net I, we're doing some manual HTML coding to create very, VERY simple websites (at least, local pages that open in browsers). Kind of tedious to do it manually, but I think it makes things much clearer. And I'm finally learned about putting the pages in a folder with relative references . . . if only this simple fact had been made clearer to me a few years ago. But I'm looking forward to working on our next assignment, which is to create a web page for a favorite artist. I may cheat and do mine on Edward Tufte, who IS an artist but is known much, much better for his work on data visualization. Here's the man himself:

For reference, here are his major publications, all of which are gorgeous and should be required reading for all designers and data people:

Anyhow, it should be fun.

Comment

Comment

Rhetoric: The Visual and the Procedural

I was out making the rounds to promote my class in Generative Art a few weeks ago and one of the advisors mentioned a class in the Writing Program called "Visual Rhetoric." Interesting; not visual analysis or visual design or visual whatever, but "rhetoric." I had to look it up. From the Oxford American Dictionary, rhetoric is "the art of effective or persuasive speaking or writing, esp. the use of figures of speech and other compositional techniques." Okay, now apply that to visual information. Anyhow, I spoke with the teacher, Natalie Stillman-Webb, who also sent me a copy of her syllabus. Very cool stuff. She even invited me to come and talk about data visualization later in the semester. Excellent. And then, yesterday, I discovered an extension of the same idea. Ian Bogost teaches videogame design, theory, and criticism at Georgia Tech and has several books on Amazon. (Here's his personal web page: bogost.com) One of his books is called "Persuasive Games: The Expressive Power of Videogames" (here's the link at Amazon) and in it he develops the idea of "Procedural Rhetoric," or persuasive arguments based on behaviors or interactions as one finds in video games. (You can download the first chapter of the book here or see a small wiki entry on the topic.) Anyhow, I've ordered the book but haven't read it yet. It's a fascinating concept and I look forward to learning more about it.

And with that, I'm going to go do some homework for Monday. Whee!

Comment