Viewing entries tagged
data visualization

1 Comment

New media and video game activism at the New Frontier exhibit

[Above: Stills from two critical video games by Molleindustria: "Oiligarchy" and "The McDonald's game."]

Woo hoo! The Sundance Film Festival is getting frisky! They've included non-film art — new media video work and video game art, to be particular — in this year's festival and, Holy Moses, there's some amazing things going on. The exhibit, entitled New Frontier, is on display at the Utah Museum of Contemporary Art through May 19.

Excellent large scale data visualizations about wildlife encroachment, a participatory Kinect piece about a disaster at a Los Angeles food bank, a 3-D celebration (sort of) of aggression in Hollywood, people raging at their computers, and video games that you always lose no matter what. It's all from what you might call "the art of discomfort" but it's amazing.

I'm so glad to see this in Salt Lake City!

1 Comment

Comment

More Than a Straight Line This Time

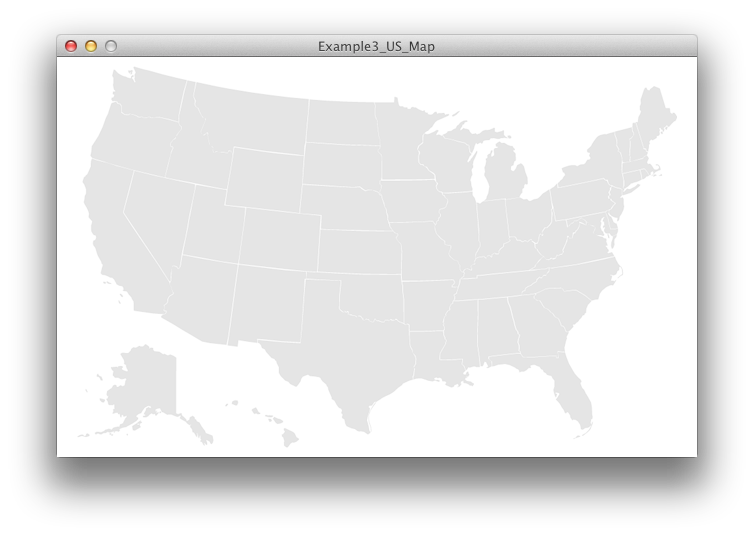
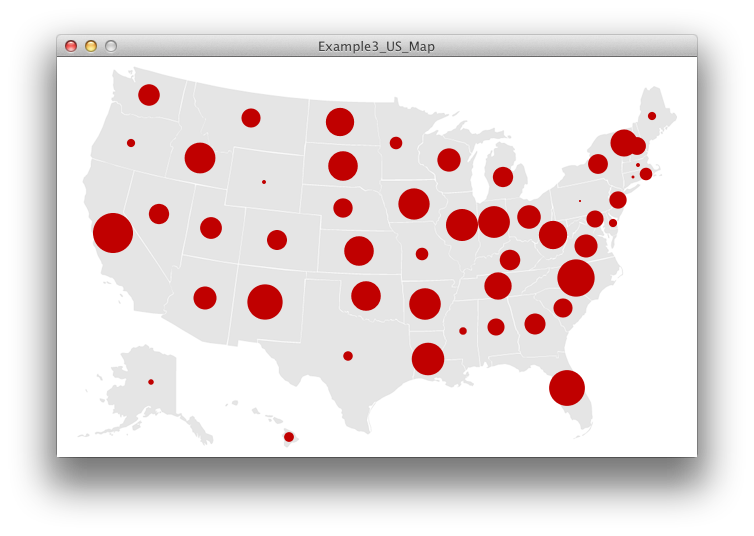
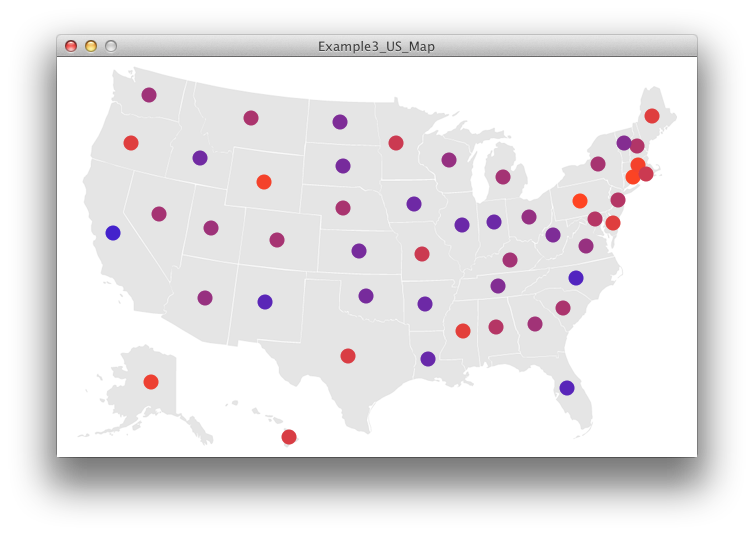
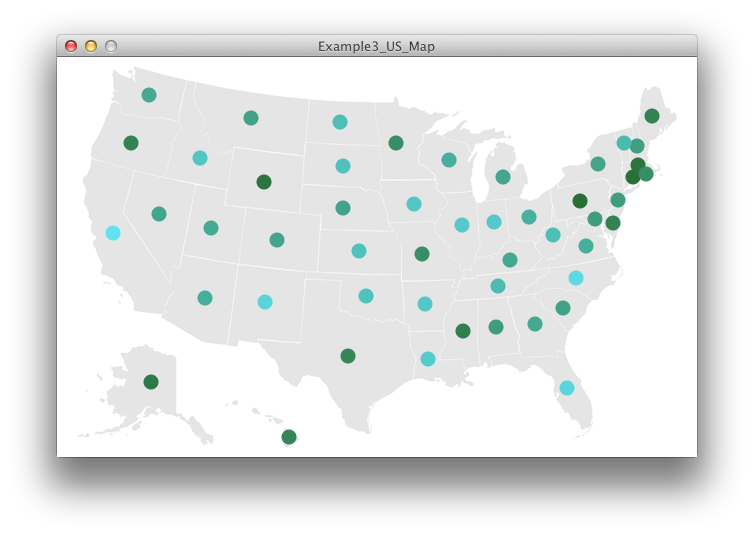
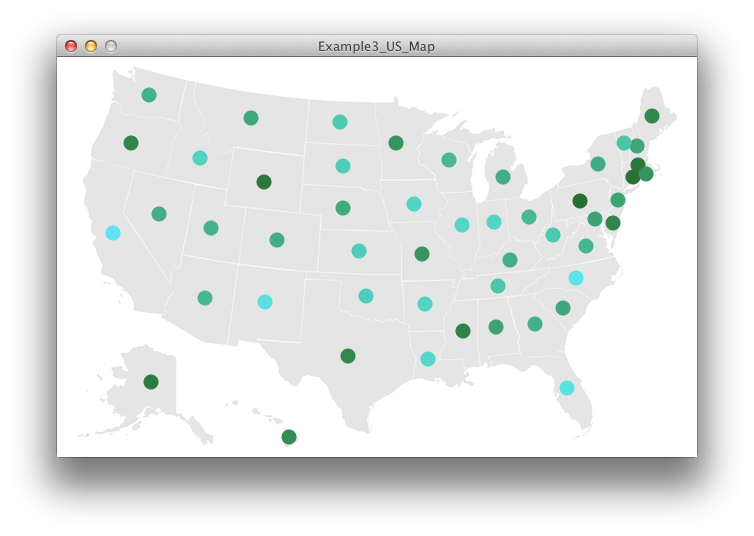
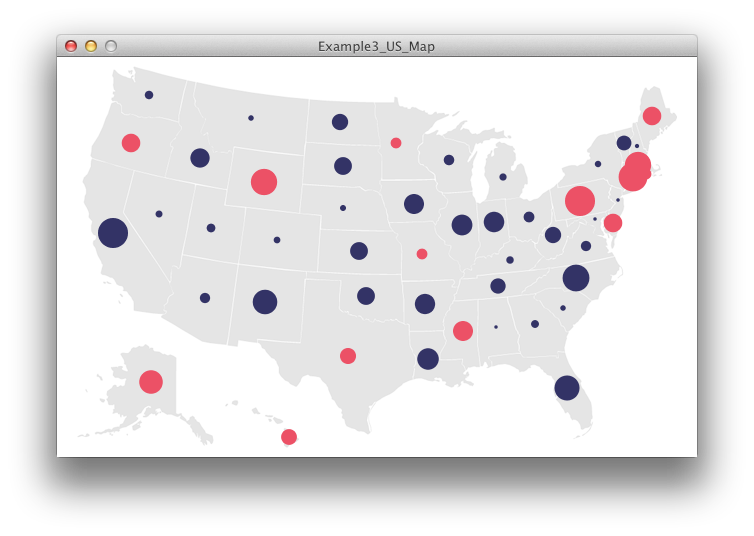
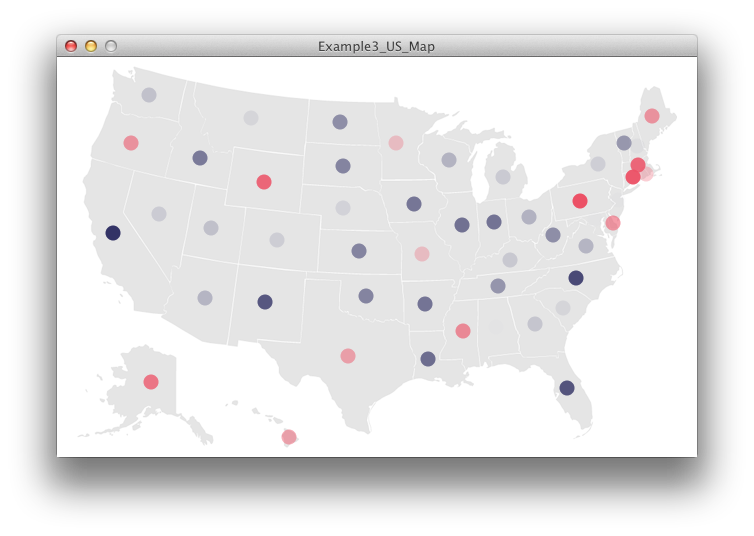
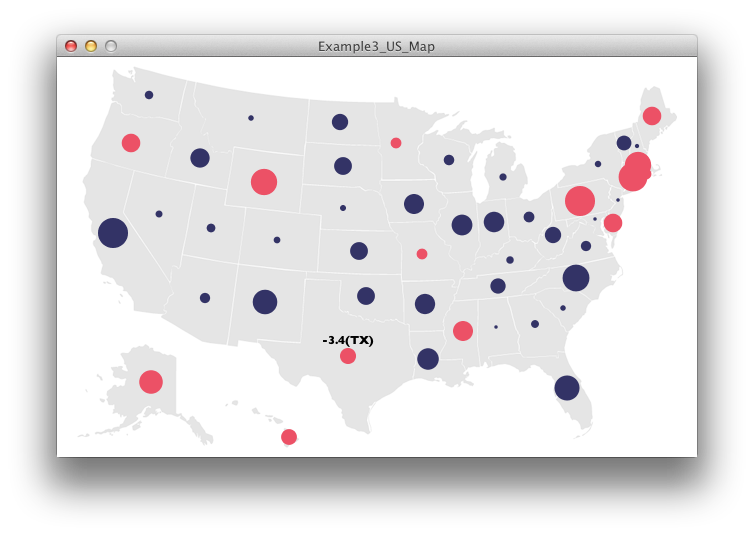
When I last posted on my work with Ben Fry's excellent book Visualizing Data, I posted all of two drawings, both of which were made with straight lines. Well, Chapter 3, "Mapping," does a heck of a lot more than that. It took me two days to get through this chapter (as opposed to 1:48 — I timed it — for Chapter 2). It was working on an interactive map of the US. Anyhow, the gallery above contains the many version of the sketches I did while following along with the examples. The still photos do not demonstrate the interactive, changing nature of several of these sketches, I've embedded a YouTube video below:

[youtube=http://www.youtube.com/watch?v=_Bm6nhZYW1o]

In the meantime, I think I need to go back to Daniel Shiffman's fabulous book Learning Processing to get up to speed on some of the intermediate stuff first.

Completed:

  • Visualizing Data, Ch. 3: Mapping (17 exercises)

Comment

1 Comment

"Visualizing Data" for Real Now

As part of my independent studies projects this semester (of which there are four), I'll be reporting on each step here on this blog. This is so my supervising professor — in this case, that's Photography professor Ed Bateman  (Hi, Ed!) — can see what I'm doing and grade my work accordingly. It's also to show my university that I did something useful for my sabbatical. Finally, it's to show something that may be of use to other people who are trying to learn the same things that I'm working on.

With that said, my first project centers on the wonderful programming environment Processing and the equally wonderful book Visualizing Data by Processing co-creator Ben Fry. (I bought this book a year and a half ago so it's time I actually did something with it....) This book and course of study are follow-ups to the introductory course on Processing that I taught last semester at the University of Utah using the much shorter book Getting Started with Processing, also by Ben Fry and the other Processing co-founder, Casey Reas.

(As an interesting note, part of what has finally gotten me around to doing this is the fact that I now have the book not only in print but in ebook format, which I read on my wonderful new Kindle Touch and on the Kindle software on my Mac. It beats Apple's iBook hands down. Also, I can have the book open on my MacBook's monitor and have all of the working material open on my big external monitor at the same time. I'm in paradise.)

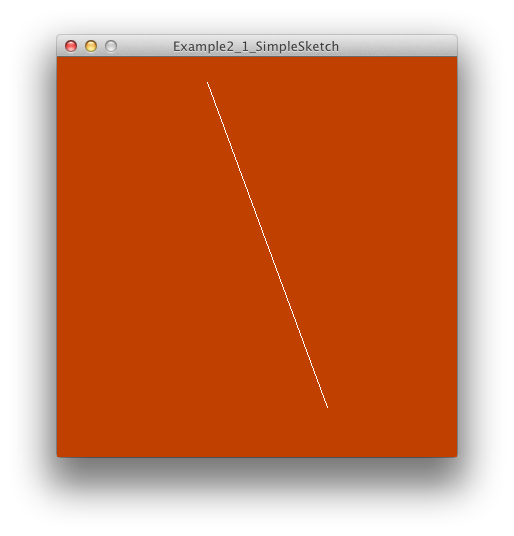
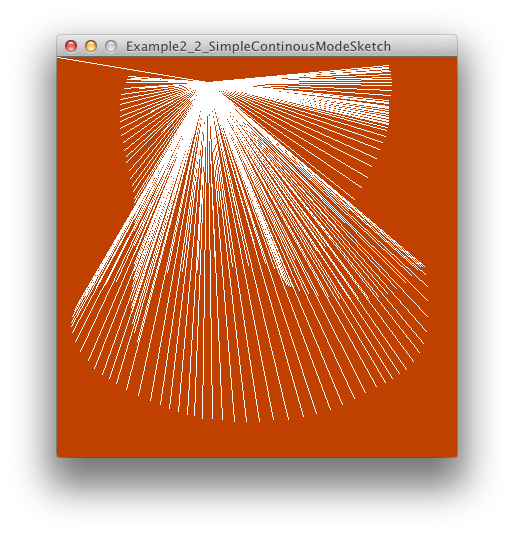
Sooooo, for today, I went through the Preface and the first two chapters (for about the fourth time) and, to prove it, I've included screenshots of the two numbered examples in those chapters, which I've recreated by hand. Extremely basic but always so rewarding. I've also included a short video clip of the second one in action:

[youtube=http://www.youtube.com/watch?v=JCCAjVb6nEg]

Completed:

  • Visualizing Data, Ch. 0: Preface (0 exercises)
  • Visualizing Data, Ch. 1: The Seven Stages of Visualizing Data (2 exercises)

1 Comment

Comment

Art and the Psychological Scientist

I gave a talk yesterday to the Cognition and Neural Science PhD students in the Psychology Department at the University of Utah. My title was “Art and the Psychological Scientist” (PDF available here). I talked about data art, information visualization, and Processing, among other things. It was very nice to finally connect with the Psych department there. (I am, after all, a psychology professor.) A few of the students are developing a course on art and psychology and I’m excited to see what comes of that. (And, Martin, that’s why I left class after the quiz; I had to get ready!)

Comment

Comment

Adobe and Me

We're getting started with Photoshop (and the Adobe Creative Suite in general) in FA2000: Computers and the Arts. Very exciting! It's an overwhelming program; so many choices, so many buttons. Ay yi yi . . . But I'm thrilled to have put the lettuce and beans on their own layers in the salad photo! Very cool to move things around so easily. To quote the theme from The Love Boat: "So exciting and new!" (Well, new to me, anyhow.)

Also, in FA3000: Design for the Net I, we're doing some manual HTML coding to create very, VERY simple websites (at least, local pages that open in browsers). Kind of tedious to do it manually, but I think it makes things much clearer. And I'm finally learned about putting the pages in a folder with relative references . . . if only this simple fact had been made clearer to me a few years ago. But I'm looking forward to working on our next assignment, which is to create a web page for a favorite artist. I may cheat and do mine on Edward Tufte, who IS an artist but is known much, much better for his work on data visualization. Here's the man himself:

For reference, here are his major publications, all of which are gorgeous and should be required reading for all designers and data people:

Anyhow, it should be fun.

Comment

1 Comment

Time to Hit the Road

Well, I've been a full-time faculty member at UVU for nine years and I think it's time for a sabbatical. I applied three years ago, when I was first eligible, but my plans at that time weren't particularly compelling and the University wasn't handing out many sabbaticals at that time, so it was a non-starter. This time, however, I'm much more optimistic. My goal is to bring a comprehensive data visualization curriculum to UVU. To do that, though, I have to go off and learn a bunch of new things, like how to program for the web and how to use a variety of analysis applications. So, I submitted my application letter to my department chair today. (You can actually see the letter here.)

I plan to keep this blog as a complete record of my sabbatical from application to completion, so check in frequently, okay?

And wish me luck!

1 Comment