With that said, my first project centers on the wonderful programming environment Processing and the equally wonderful book Visualizing Data by Processing co-creator Ben Fry. (I bought this book a year and a half ago so it's time I actually did something with it....) This book and course of study are follow-ups to the introductory course on Processing that I taught last semester at the University of Utah using the much shorter book Getting Started with Processing, also by Ben Fry and the other Processing co-founder, Casey Reas.
(As an interesting note, part of what has finally gotten me around to doing this is the fact that I now have the book not only in print but in ebook format, which I read on my wonderful new Kindle Touch and on the Kindle software on my Mac. It beats Apple's iBook hands down. Also, I can have the book open on my MacBook's monitor and have all of the working material open on my big external monitor at the same time. I'm in paradise.)
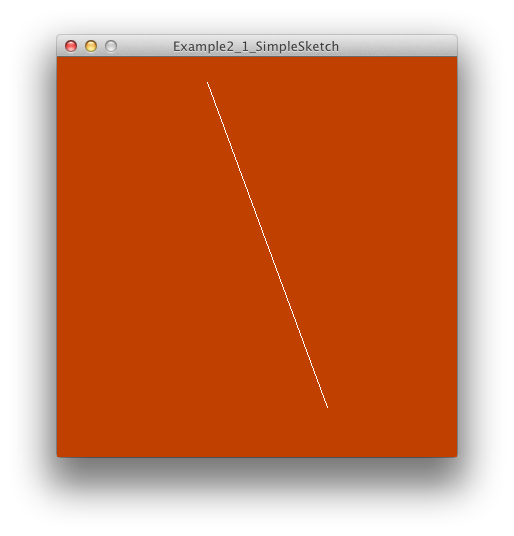
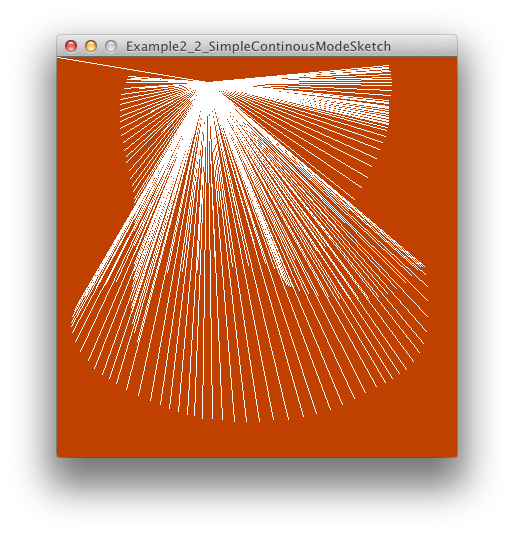
Sooooo, for today, I went through the Preface and the first two chapters (for about the fourth time) and, to prove it, I've included screenshots of the two numbered examples in those chapters, which I've recreated by hand. Extremely basic but always so rewarding. I've also included a short video clip of the second one in action:
[youtube=http://www.youtube.com/watch?v=JCCAjVb6nEg]
Completed:
- Visualizing Data, Ch. 0: Preface (0 exercises)
- Visualizing Data, Ch. 1: The Seven Stages of Visualizing Data (2 exercises)

